
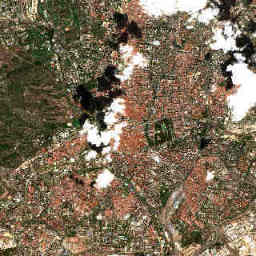
Currently available image of the fixed 12 × 12 km study area. The story explains landscape patterns, not automatically detected change.
Contains modified Copernicus Sentinel data 2026.Explore the image
First find the large El Retiro park east of the centre and the green areas along the Manzanares to the west. Compare them with lighter, open areas. In the time comparison, keep looking at the same places and check the acquisition dates.
How to interpret it
Madrid has dry summers in the long-term average. Plant development, soil moisture and irrigation can therefore produce different colours within the same image. Their spatial pattern is a useful starting point for questions about urban greenery and summer water demand.
What it cannot tell us
Brown does not prove drought damage, and green does not prove a cool surface. These Sentinel-2 true-colour images do not measure surface temperature. The vegetation indicator also describes classified samples within the study area, not the whole city.
What additional data could show
A reliable heat analysis would require thermal satellite measurements and weather stations. Long records of precipitation and temperature help distinguish a single dry summer from a climate trend. AEMET climate normals and Copernicus ERA5 are possible starting points; they are not yet integrated here as time series.
Sources and further data
Editorial interpretation · Updated 29 October 2026. The image and its source details update automatically; the explanatory text is maintained editorially.