
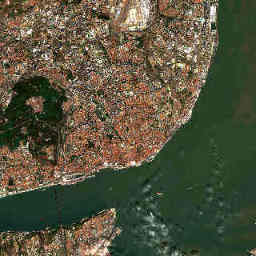
Currently available image of the fixed 12 × 12 km study area. The story explains landscape patterns, not automatically detected change.
Contains modified Copernicus Sentinel data 2026.Explore the image
Find the broad northern bank of the Tagus and the urban areas behind it. This small crop shows only part of the estuary; the open Atlantic coast lies outside it. When comparing years, check that the same shores and water areas are actually visible.
How to interpret it
In estuaries, tides and river discharge affect water level; suspended material and light affect visible water colour. An image captures these conditions at one moment. Water and land therefore do not always form a permanently sharp boundary along the shore.
What it cannot tell us
A different-looking shoreline proves neither coastal erosion nor sea-level rise. Such an analysis must account for factors including tidal level, waves, image geometry and a longer time series. This preview is neither a flood map nor a hazard forecast.
What additional data could show
Tide gauges, wave and sea-level data would be a useful next layer for coastal areas. Copernicus Marine offers open data products for this purpose. Before combining them, locations, time references and the distinction between measurements, models and forecasts must align. These data are not yet displayed here as a dashboard.
Sources and further data
Editorial interpretation · Updated 29 October 2026. The image and its source details update automatically; the explanatory text is maintained editorially.